An endpoint can sound like a place every participant reached. In a research analysis, it may instead be a defined value assembled from observations and a rule for handling missing information. To read it carefully, ask two questions before interpreting the number: what was measured, and how did that measurement enter the calculation? A useful fieldnote keeps the original observation and the analytic value on separate lines.
In Porst’s randomized, blinded oral tadalafil trial, questionnaire analysis required baseline and at least one postbaseline measurement; missing erectile-function scores used last observation carried forward. That documented rule provides the question for this guide. The numerical examples below are hypothetical demonstrations, not reconstructed participant records. They show how change scores, group averages and assumptions about unobserved visits fit together. Reading those operations closely is more informative than treating the height of a bar as a forecast for one person.
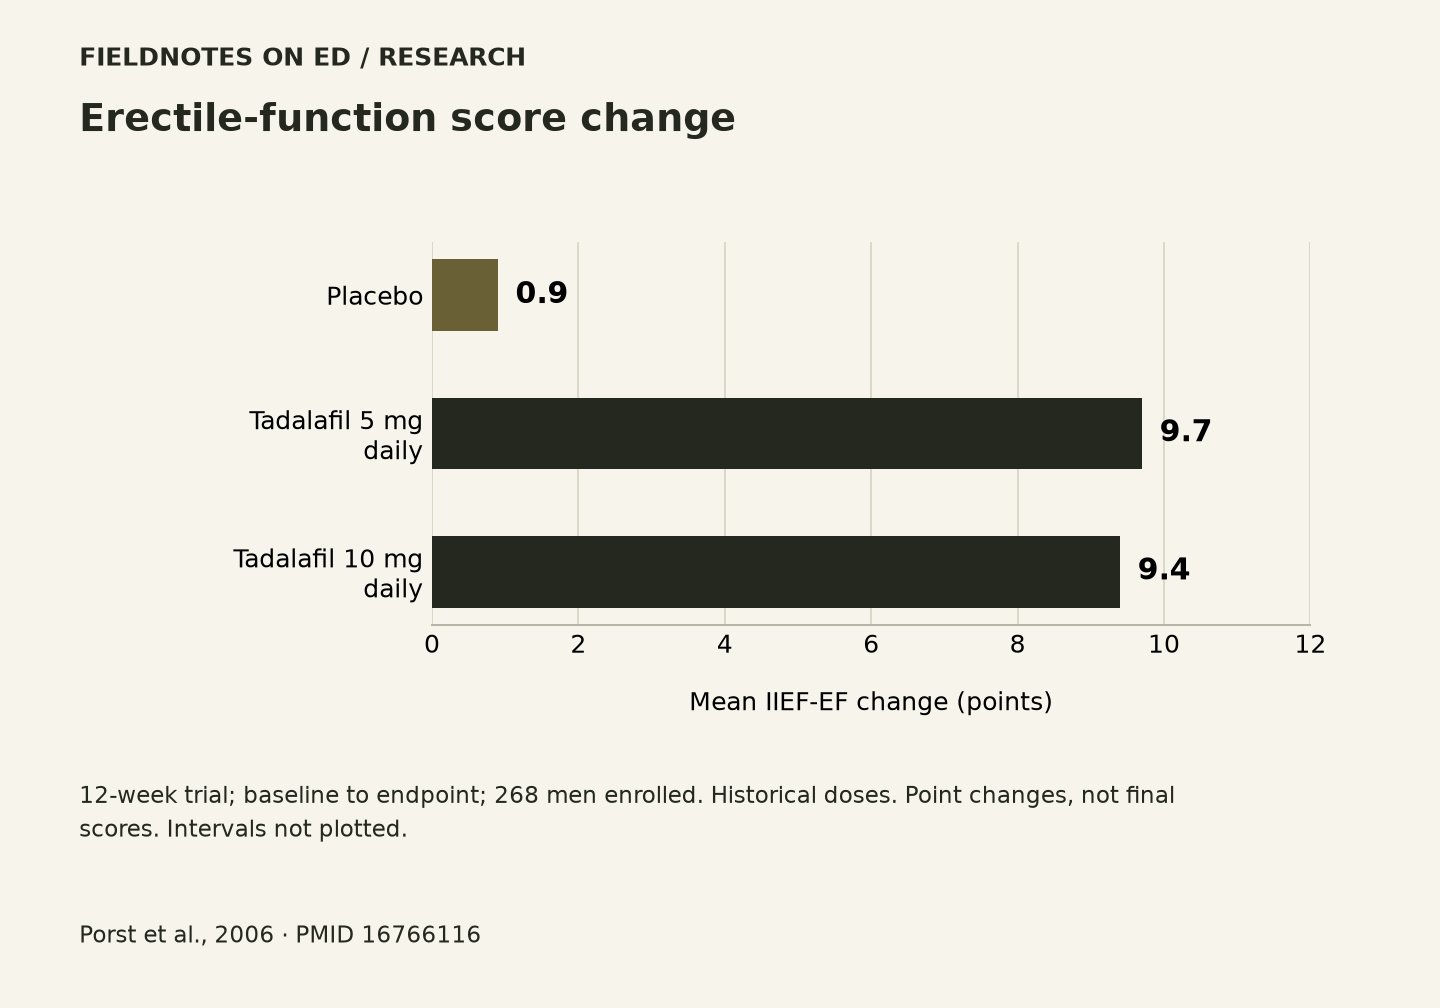
Trial chart and data
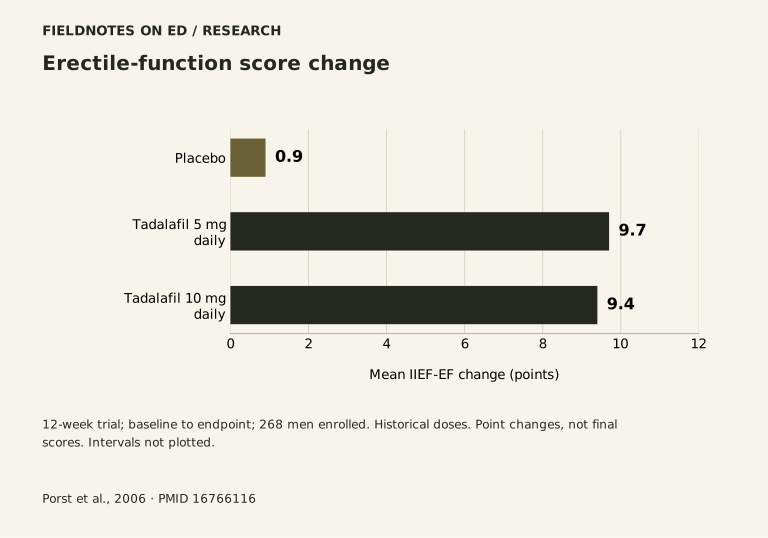
Download chart (PNG) · Download data (CSV) · Download vector (SVG)
| Study group | Reported value |
|---|---|
| Placebo | 0.9 |
| Tadalafil 5 mg daily | 9.7 |
| Tadalafil 10 mg daily | 9.4 |
12-week trial; baseline to endpoint; 268 men enrolled.
Historical doses. Point changes, not final scores. Intervals not plotted.
Give every number a unit and a job
Begin with a blank line for the quantity being estimated. Is it a questionnaire level, a change in points, a proportion meeting a definition, or a difference between groups? Those quantities can describe related experiences while answering different questions. A score is a number produced by an instrument’s scoring rules. A proportion counts people or events satisfying an explicit condition. Converting one into the other requires information that a single average does not contain.
The word improvement also needs a job description. It might refer to a positive numerical change, a participant’s overall judgment, or crossing a defined threshold. Those meanings should not drift within a paragraph. For this reading exercise, retain the unit stated by the measurement and avoid translating it into a percentage of people helped. A point change also does not establish permanent resolution of a condition: the time of observation remains part of the result. When making notes, give the outcome a complete noun phrase before adding any number. That small discipline prevents a visually simple figure from acquiring several different meanings as it moves into conversation.
Reconstruct change from both ends
Change is later value minus earlier value. An endpoint level answers where the measurement stood; a change answers how far it moved from its starting position. In a hypothetical score example, one person moves from 11 to 17 and another from 19 to 25. Both changes equal six points, although the endpoint levels differ. These invented values illustrate subtraction only. They do not define clinical categories, demonstrate a meaningful threshold or represent anyone in the study.
Averaging individual changes adds another operation. If the same people contribute both measurements and each is weighted equally, the mean of their changes equals the difference between their mean later and earlier scores. If the membership changes between visits, subtracting two available-case averages can mix actual change with a change in who supplied information. That is why a baseline column and an endpoint column need their population definitions attached. Our response-review fieldnote makes a practical connection: a dated description preserves the starting point and later experience for a clinical discussion. It does not turn personal observations into a treatment-effect estimate.
| Hypothetical record | Calculation | Interpretation |
|---|---|---|
| Person A: 11 then 17 | 17 − 11 = 6 points | Change is six; endpoint is seventeen |
| Person B: 19 then 25 | 25 − 19 = 6 points | Same change; different endpoint |
| Average of these two changes | (6 + 6) / 2 = 6 points | Describes this invented pair only |
Check who earns a row in the analysis
An analysis population is the set of people whose records satisfy the rules for a particular calculation. Enrollment, treatment exposure, attendance and available measurements are different conditions. A study can begin with a participant count yet use a smaller or differently defined set for an outcome. The useful question is not whether one count looks impressive; it is how the analysis definition relates to the research question and the information actually collected.
Consider a hypothetical requirement for both an initial measurement and some later information. Someone who leaves before any follow-up would have no observed change to calculate. Excluding that record may be operationally understandable, but the interpretation then depends on why such records are absent and whether their absence relates to treatment or outcome. Random assignment alone cannot manufacture those measurements. A reader should request a count and an explanation for exclusions rather than silently equating all enrolled people with all analyzed people. The sildenafil selection notebook examines a related issue at the doorway into another follow-up phase. Here the focus is the doorway into a numerical analysis.
An earlier score does not become a later observation
Last observation carried forward is a calculation rule: when the required later value is missing, an earlier available value occupies its place. To understand the rule, keep the date of the actual measurement visible. The method can produce a complete-looking analysis column while leaving a gap in knowledge about what happened at the later visit. Filling the column solves an arithmetic problem; it does not recover the absent experience.
For a wholly invented record, suppose the baseline score is 13, an interim score is 18, and the endpoint visit is missed. Carrying the interim value forward yields an analyzed change of five points. If the unobserved later score would have been 15, that assigned change is too high by three points. If it would have been 21, the assigned change is too low by three. Neither alternative is asserted as true. They show why the direction of error depends on the unseen trajectory. This rule can therefore neither be assumed optimistic nor declared conservative simply from its name. The scientific question is whether its implied trajectory is a reasonable representation of the missing period.
| Record or scenario | Endpoint used or imagined | Change from invented baseline |
|---|---|---|
| Baseline 13; interim 18; endpoint missing | Carry forward 18 | Assigned change: +5 |
| Hypothetical later decline | Imagine 15 | Would instead be +2 |
| Hypothetical later increase | Imagine 21 | Would instead be +8 |
Ask what made the visit disappear
The consequences of missing information depend on its relationship to the outcome. A missed appointment caused by an unrelated scheduling problem raises a different analytic question from withdrawal after a disappointing experience. Even these explanations may be incomplete: an observed reason does not necessarily reveal the unobserved score. A useful audit asks what was known before the gap, what reason was recorded, and which parts of the later experience remain unknown.
Imagine two hypothetical groups with the same fraction of missing endpoints. In one, missingness occurs across earlier score levels without an obvious pattern. In the other, nearly all missing records follow poor earlier reports. Equal percentages of missing data would not make the information loss equivalent. Comparing the observed histories can help investigate whether an assumption is plausible, but cannot prove the unseen values. This is why a single statement that few visits were missed is insufficient by itself. The assessment guide offers a separate reminder to describe uncertainty explicitly in care conversations. An unknown observation should remain identifiable, rather than being rewritten as a confident account of what occurred.
Test the assumption with an alternate world
A sensitivity analysis asks whether the interpretation survives a plausible change in an uncertain assumption. For missing outcomes, one could vary the values assigned to absent records and recalculate the result. The question is not which imaginary dataset is true. It is how dependent the conclusion is on assumptions that cannot be checked directly from the available observations. This section describes an analytic exercise a reader might request, not additional analyses attributed to the paper.
Consider an invented group of ten people, eight with recorded changes totaling 40 points and two with missing changes. Assigning zero to each missing change gives a ten-person mean of four points. Assigning minus five to each gives a mean of three; assigning plus five to each gives a mean of five. The observed subtotal remains fixed while the assumption moves the estimate. Comparing treatment groups would require applying justified assumptions to missing outcomes in each group, which need not be identical. A more demanding question asks how unfavorable the missing records would need to be before the substantive conclusion changed, and whether that scenario is credible given the known histories.
An average needs a neighborhood
A mean describes a center and leaves the surrounding distribution unresolved. Two invented sets of changes, four and four versus zero and eight, each average four points. In the first pair the experiences match; in the second they differ sharply. An average alone cannot tell us which pattern is closer to the observations, how many people improved, or how often an individual experienced an unfavorable change. Those questions require information about the distribution or a separately defined response measure.
Uncertainty around an estimated mean is another matter. A confidence interval concerns the precision of an estimate under the analysis model; the spread of individual outcomes concerns variation between people. Neither is a substitute for the other. A chart without uncertainty intervals is insufficient for judging whether nearby estimates are meaningfully distinguishable. Similarly, failure to establish a difference does not establish equivalence. An equivalence claim needs a defined margin and an appropriate analysis. This is an interpretation rule for reading estimates, not a new comparison between the arms in the figure. Keep the mean, its precision, individual variation and the intended comparison as four separate entries in the notebook.
Match each outcome to its own scientific question
A questionnaire domain, an event diary and a broad judgment of improvement can disagree without one necessarily being an error. Each may summarize a different part of experience over a different interval. Before comparing them, identify who answered, the period covered, how the value was constructed and what counted as a positive result. A participant-level proportion and an event-level proportion can even give different weight to people who report different numbers of events.
Primary and secondary outcomes also have distinct roles in a study plan. A primary outcome is designated to address a central question; additional outcomes can explore related dimensions. Looking across many analyses increases the opportunity to encounter an apparently favorable result by chance, so the planned comparison and any multiplicity adjustment matter. A reader should ask for those details rather than selecting whichever number looks strongest. Disclosure information helps frame further questions about analytic planning and reporting. It does not itself prove that an estimate is biased or unbiased. For a documentary comparison, the Hims profile can help locate service terms; it cannot supply the missing research design or establish the service’s outcomes.
Read the daily schedule through current labeling
Current Cialis labeling for daily ED use starts at 2.5 mg and allows an increase to 5 mg based on efficacy and tolerability. The figure’s higher daily regimen is historical, outside routine daily ED labeling. Nitrates and guanylate cyclase stimulators such as riociguat are contraindicated. Cardiovascular status, kidney or liver function, alpha-blockers, antihypertensives, strong CYP3A4 inhibitors and substantial alcohol require assessment. Headache, indigestion, back pain and muscle aches are recognized adverse reactions.
An erection lasting more than four hours requires emergency care. For sudden loss of vision or a sudden decrease or loss of hearing, stop treatment and obtain prompt medical attention. If chest pain develops during sexual activity, stop the activity and get immediate care. Do not combine PDE5 inhibitors or adjust treatment independently. Keep these instructions separate from the research arithmetic. A numerical difference between groups is not a dose-selection rule, and an historical regimen is not an instruction to reproduce it. The medicine-identity guide helps prepare the exact prescription details for a clinician or pharmacist, while the blood-pressure fieldnote organizes related health-information questions.
Finish with a traceable product and a bounded question
As an editorial interpretation, the practical value of a measurement audit is that it narrows the question you bring to care. Write down what outcome matters to you, what observation would help assess it, and what remains unknown about the proposed product. The Ro profile can be used to check documentary terms. It is not evidence that a service reproduces a research population, observation schedule or clinical result. The ingredient name is only one part of that comparison.
FDA explains that compounded drugs are not FDA-approved and are not reviewed by the agency before marketing for safety, effectiveness and quality, although compounding can address legitimate medical needs. A different formulation, combination or route therefore needs its own evidence assessment; a familiar ingredient does not settle the comparison. Ask for the full product identity and a clear route for discussing the response with the treating team. Keep commercial details, clinical observations and research claims in distinct notes. That arrangement makes an unresolved question easier to identify and discuss without pretending that a published average decides which individual treatment or service should be chosen.
Questions about the evidence
Is an endpoint necessarily a measurement from the final visit?
Not necessarily. Endpoint is an analytic term whose construction must be checked. It may refer to an observed measurement or a value assigned under a missing-data rule. The important distinction is between when a value was actually measured and how it was used in the analysis.
Does carrying a score forward make a result more cautious?
There is no guaranteed direction. If an unseen later value would have worsened, keeping an earlier value can overstate improvement; if it would have improved, the same rule can understate it. These possibilities explain why the assumption needs examination rather than an automatically favorable label.
Why can two people have the same improvement but different outcomes?
They can start at different levels. Subtracting an earlier score from a later score describes movement, while the later score describes the endpoint level. Both quantities may be useful, but a shared numerical change does not establish a shared clinical state or personal experience.
What would make an analysis of missing measurements more convincing?
A clear account of which records are absent, when gaps began, what was known beforehand and how estimates respond to plausible alternative assumptions. Such information would help assess robustness. It would still not reveal every missing value or remove the need to state the analysis population accurately.
Can an average change predict my own result?
It cannot provide an individual forecast by itself. You would need information about variation, relevant personal characteristics, treatment context and uncertainty. Even then, a prediction would remain uncertain. A clinician can help define what to observe and how to discuss it without turning a group average into a promised outcome.
Editorial assessment
A useful endpoint audit preserves the difference between a measured score and an analytic decision. Start with the unit, reconstruct the change, identify who contributed information, and examine what replaced a missing value. Then ask whether another reasonable assumption would change the interpretation. The resulting fieldnote is a precise account of what an estimate represents, with a clearly stated question for the next clinical or scientific discussion.
Research access and limitations
Complete paper reviewed via USPTO; no protocol or participant-data review. Worked examples are invented methodological demonstrations, not recovered records or additional study findings.
Trace the information
Scientific sources carry their own access dates below. Existing medical and provider records retain their original October 6 or 7 checks. Provider pages establish advertised claims. Medical sources supply general context; citation does not imply endorsement.
- Porst et al. (2006): daily tadalafil trialFull primary paper via public exhibit · Checked 2026-10-23Full primary paper (PDF)
- Goldstein et al. (1998): oral sildenafil trialFull primary paper via public exhibit · Checked 2026-10-23Full primary paper (PDF)
- Cialis (tadalafil) prescribing informationOfficial prescribing information; relevant sections reviewed · Checked 2026-10-23
- Understanding the risks of compounded drugsFDA public guidance · Checked 2026-10-23